A rich retirement is something most people can only dream about. It requires decades of prudent planning and disciplined investment to achieve.
But ultimately the difference between retiring in comfort, retiring in splendor, or not retiring at all, comes down to whether you're able to make what Charlie Munger calls “consistently not stupid” decisions.
It is remarkable how much long-term advantage people like us have gotten by trying to be consistently not stupid, instead of trying to be very intelligent.” – Charlie Munger
One of the easiest ways to generate superior long-term returns in the stock market is through alpha-factor investing.
The trouble is that no strategy will work all of the time, which is the only reason that any of them work over the long term.
But this is where the power of alpha stacking comes in. You can often combine several alpha factors into a single investment, as the dividend aristocrats have been doing for decades.
Dividend Aristocrats: Market-Beating Returns For 30 Years
| Year | Aristocrats Returns | Cumulative Returns | S&P 500 Total Returns | Cumulative Returns |
| 1990 | 5.70% | 105.70% | -3.2% | 96.8% |
| 1991 | 38.50% | 146.4% | 30.4% | 126.2% |
| 1992 | 10.10% | 161.2% | 7.6% | 135.8% |
| 1993 | 4.30% | 168.1% | 10.1% | 149.5% |
| 1994 | 0.90% | 169.6% | 1.3% | 151.5% |
| 1995 | 34.60% | 228.3% | 37.6% | 208.4% |
| 1996 | 20.90% | 276.0% | 22.9% | 256.2% |
| 1997 | 34.50% | 371.3% | 33.3% | 341.5% |
| 1998 | 16.80% | 433.6% | 28.6% | 439.1% |
| 1999 | -5.40% | 410.2% | 21.0% | 531.4% |
| 2000 | 10.10% | 451.7% | -9.1% | 483.0% |
| 2001 | 10.80% | 500.4% | -11.9% | 425.5% |
| 2002 | -9.90% | 450.9% | -22.1% | 331.5% |
| 2003 | 25.40% | 565.4% | 28.7% | 426.6% |
| 2004 | 15.50% | 653.1% | 10.9% | 473.1% |
| 2005 | 3.70% | 677.2% | 4.9% | 496.3% |
| 2006 | 17.30% | 794.4% | 15.8% | 574.7% |
| 2007 | -2.10% | 777.7% | 5.6% | 606.9% |
| 2008 | -21.90% | 607.4% | -37.0% | 382.4% |
| 2009 | 26.60% | 768.9% | 26.4% | 483.3% |
| 2010 | 19.40% | 918.1% | 15.1% | 556.3% |
| 2011 | 8.30% | 994.3% | 2.1% | 568.0% |
| 2012 | 16.90% | 1162.4% | 16.0% | 658.8% |
| 2013 | 32.30% | 1537.8% | 32.4% | 872.3% |
| 2014 | 15.80% | 1780.8% | 13.7% | 991.8% |
| 2015 | 0.90% | 1796.8% | 1.4% | 1005.7% |
| 2016 | 11.80% | 2008.8% | 12.0% | 1126.4% |
| 2017 | 21.70% | 2444.7% | 21.8% | 1371.9% |
| 2018 | -2.70% | 2378.7% | -4.4% | 1311.5% |
| 2019 | 28% | 3044.8% | 31.5% | 1724.7% |
| 2020 | 8.70% | 3309.7% | 18.4% | 2042.0% |
| Aristocrats Median Return Since 1990 | Average Return Since 1990 | Annualized Returns Since 1990 | S&P 500 Annual Returns Since 1990 | Annual Outperformance |
| 11.80% | 12.8% | 12.30% | 10.75% | 1.55% |
The aristocrats, as a group, combine five alpha factors in one.
- smaller size
- relatively better valuation
- lower long-term volatility
- the most dependable dividend growth on earth
- superior quality (as measured by returns on capital and other profitability metrics)
You can also equally weight them if that's your preferred risk management method, achieving six out of seven alpha factors in one.
However, today the aristocrats are 23% overvalued. Granted the S&P 500 is 36% overvalued, and analysts expect that aristocrats will still achieve superior returns.
- 7.9% CAGR over the coming decades for the S&P 500
- 10.6% for aristocrats
But of course, the long term is made up of many short-term periods and high valuations mean that beating the broader market may not actually help you achieve your retirement goals.
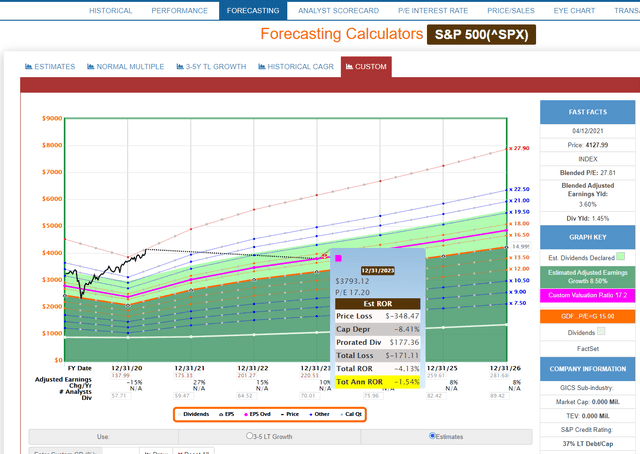
S&P 500 2023 Consensus Total Return Potential

- 60% EPS growth in 3 years = 16.9% CAGR
- yet the market has priced it all in and bit more
The good news is that over longer time periods, the broader market should still deliver modestly positive returns.
Full story on SeekingAlpha.com

